
|
|
#1 |
|
Участник
|
powerobjects: Enabling R Scripts in Power BI Desktop
Источник: https://www.powerobjects.com/2018/11...ipts-power-bi/
==============  Since the September 2016 release, Power BI has enabled users to extend Power BI’s out-of-the box functionality utilizing R Scripts. But what is R? It is an open-source statistical data programming language that allows you to manipulate and display complex data sets on the fly. R is an extremely powerful tool, but because of its level of complexity, it can also be time consuming. In today’s blog, we’ll be describing the capabilities of R visuals and begin exploring ways in which using R can enhance a user’s experience in Power BI. To do this, we need to: 1. Discuss the benefits of R 2. Enable R Scripting 3. Install R and R Studio 4. Configure Power BI to use an external IDE 5. Customize your R Script to use Power BI Redmonder Let’s begin… Discuss the benefits of R The benefits of R can be divided into 2 main categories: Analytics and Reporting. Analytics: For Dynamics 365 CRM and ERP users, R scripts can be incredibly useful in solving real-world problems through statistical analysis. Microsoft MVP, Tomaz Kastrun, describes a situation where he has used R and Power BI to comb through 500 million historical invoices taken from Dynamics NAV to identify fraudulent records. Another application of R in D365 is being able to test your forecasts against a mean-squared error (MSE). One thing to keep in mind is that scripts can be re-used with little to no modification. If either of the above examples are of interest, please reference this link to see how you can apply R scripts within your organization and D365 environment. Reporting: In terms of reporting, one of the big questions is when to use R versus the countless built-in visualizations already available within the Power BI Desktop. Use cases for R visualizations:
 To find out more about the above use cases, please see the Additional R Resources section at the bottom of this post. Enable R Scripting Upon opening Power BI Desktop, select R script visual under the VISUALIZATIONS section:  The following message will appear asking you to “Enable script visuals.” Review the terms and select Enable. 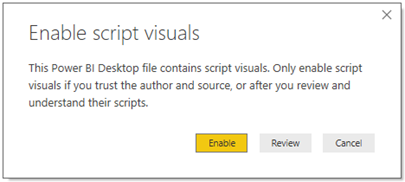 Install R and R Studio At its current state, Power BI does not have built-in R scripting. To utilize the functionality, we need to install the R library, any R packages we wish to use in development, and an IDE for development. Installing R 1. Navigate to either Microsoft R Application Network or CRAN Repository 2. Download the latest version for your OS (version 3.5.1 at the writing of this post) 3. Save the downloaded file to your computer and run “microsoft-r-open-3.5.1.exe” 4. Choose a destination folder and ensure Microsoft R Open, MRO, MKL, and Visual C/C++ Runtime 2015 are all selected 5. Select Continue and complete the installation  Installing R Studio 1. Navigate to R Studio 2. Download the latest version for your OS (version 1.1.456 at the writing of this post) 3. Save the downloaded file to your computer and run “RStudio-1.1.456.exe” 4. Choose a destination folder 5. Select Next and complete the installation 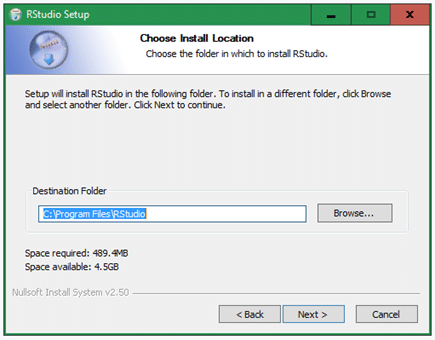 Configure Power BI to use an external IDE Now that we have R and an IDE installed, we can configure Power BI to launch R Studio when scripting. Configuring BI: 1. Launch Power BI Desktop 2. Go to: File > Options and Settings > Options > R scripting 3. Under “Detected R IDEs”, select R Studio  When creating a custom dashboard, it’s best practice to have a consistent theme throughout. When introducing R visuals, this gets a bit tricky, since R does not have built-in PBI files, which means that for each visual, we need to enter custom RBG values to get it to match up with our existing color pallet. We will be leveraging Microsoft, which recognizes people in the community through publishing exceptional R scripts that leverage Power BI. They can be found under the R Script Showcase section of the Microsoft Community site. Customize your R Script to use Power BI Redmonder 1. Navigate to R Studio 2. In the command line, enter install.packages(c(“gdata”,”ggmap”, “ggplot2”, “Redmonder”)) to install the following packages:
4. First, we need some data:  5. Create your dataset with the following values and name it anything  6. Create a new tile and select the R visual 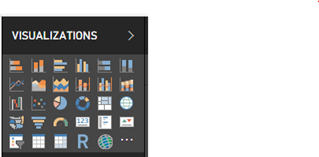 7. Select the data we just created 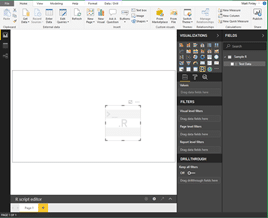 8. Type the following R Script and select Run:  You will see that that the bar graph is gray scale and may not go well with the rest of your visuals. Rather than color coding each individual bar, recall that we have downloaded the R package, “Redmonder.” This allows us to select from various default Microsoft Power BI color templates from directly within our R Script.  9. Type the following and select Run: 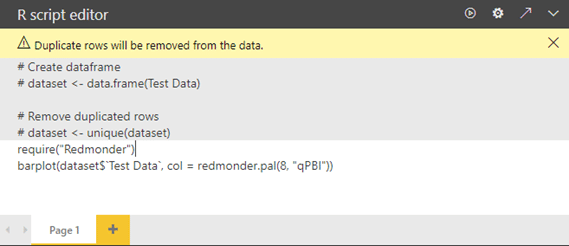 Note that the bar graph is now themed to the standard Power BI color schema:  Now that you’ve made your first R tile within Power BI and learned how to import additional R packages, check out what else the Power BI community has to offer at Microsoft’s R Script Showcase. Additional R Resources
Happy D365’ing! Источник: https://www.powerobjects.com/2018/11...ipts-power-bi/
__________________
Расскажите о новых и интересных блогах по Microsoft Dynamics, напишите личное сообщение администратору. |
|
|
|
|
| Опции темы | Поиск в этой теме |
| Опции просмотра | |
|